Leukemia Detection
Problem Statement
Every year, 65% of all deaths associated with leukemia occur in developing countries. Many of these deaths are preventable with early detection, proper treatment, and accurate diagnoses, yet there is little infrastructure in place to accurately detect leukemia in developing nations. The process for diagnosing leukemia can be performed through various tests. Manual diagnoses are done by experienced medical professionals/trained operators for physical examinations, blood tests, blood counts, bone marrow and cerebrospinal fluid biopsies. However, there are many problems with current diagnosing procedures and processes. Manual diagnosing is time-consuming, tedious, and prone to errors. To combat these issues and address the need for improved leukemia diagnostic techniques in developing countries, we sought to create a machine learning-based (ML) solution targeted at detecting leukemia from blood smear images taken by our low-cost phone-based microscope.
Implementation
Neural Network Architecture
In order to identify blood cells with acute lymphocytic leukemia (ALL), we framed the leukemia detection as a binary classification task where we must classify each blood cell as either ALL or healthy (HEM). We used ResNet-34 model pretrained on the ImageNet dataset. Freezing all parameters except for the last MLP later, we then trained this model on the publicly available Cancer Imaging Archive ALL dataset, which contains 15,135 segmented and labeled images of immature leukemic blasts and healthy lymphocytes derived from blood smears. To enhance model performance, an SGD optimizer with Nesterov momentum and a learning rate of 0.010 was used for 10 epochs on a batch size of 64 images. Input images were 257x257x3 pixels with RGB channels. To obtain the performance metrics, ten-fold cross-validation was performed.
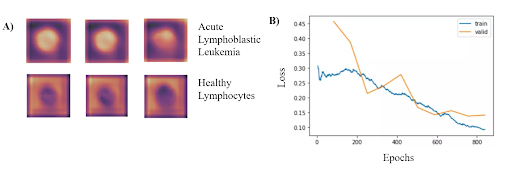
Based on the results from the binary classification, our model consistently classified cancerous lymphoblasts from healthy lymphocytes (ALL), with an accuracy of 95.72 ± 0.68% (mean ± std). This value was comparable to standard cytochemical diagnostics of acute lymphoblastic leukemia, which exhibit accuracies ranging from 86-97%. Other metrics indicating successful performance included a sensitivity of 97.24 ± 0.31%, specificity of 92.65 ± 0.74%, F1 score of 95.55% ± 0.63%, and area under the curve of 0.9922 ± 0.011. The CNN can run locally on a low-grade smartphone, with an interface allowing the user to photograph the blood smear and view previous and current results from the model. The figure on the bottom left demonstrates where in the cells that the classifier is looking at to determine if has Leukemia. Additionally, the figure on the bottom right shows the training and validation losses associated with the training of the classifier.
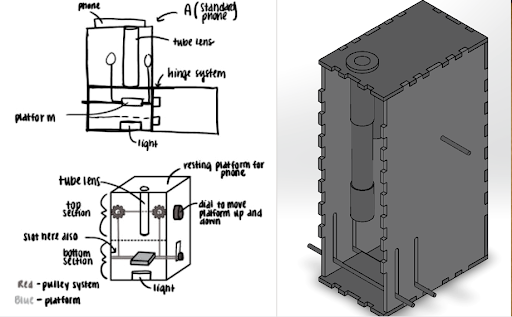
Slide Imaging Device
After analyzing various microscopy techinques, we deteremined that brightfield microscopy was the cheapest and the safest. Like traditional optical microscopes, we used convex lenses in our prototype and used the manufacturer specifications to determine the approximate distances between the lenses. We made a dual lens system and to determine the distance between them was calculated using focal lengths, image distance, and the nearpoint of the eye. For the microscope tube, we used 3D printed PLA plastic in order to get the exact dimensions. For the platform movement system, a simple pulley system was designed. The most important aspect of the pulley system is making sure both sides of the platform raise and lower equally, and to overcome this hurdle, we created a design which uses a single axle to support and adjust both sides of the pulley which can be seen. Lastly, we made sure there was ample space for the light source to be switched out if necessary.
For the microscope, once a sample of blood is obtained, the first step is to dye the sample using hematoxylin. We will then open up the front of the microscope and place the slide holding the sample onto the platform. Next, we turn on the light source to illuminate the sample. The phone is placed on the top of the eyepiece. From here, we simply adjust the platform height using the pulley system until the image is brought into focus.
Mobile App
A key part of ensuring that our detection algorithm was accessible to our target audience was developing an easy-to-use mobile app that was capable of running on low-cost smartphone devices. In order to develop this, we utilized React Native, a cross-platform app development framework with capabilities to easily create and deploy apps capable of running on any grade or type of smart device. Another important aspect of creating a viable user interface for developing nations was ensuring that the algorithm would be able to run locally without a need for data, wifi, or cloud computing resources. To meet this goal, we utilized TensorFlow Lite, an open-source platform with the ability to allow for on-device inference.
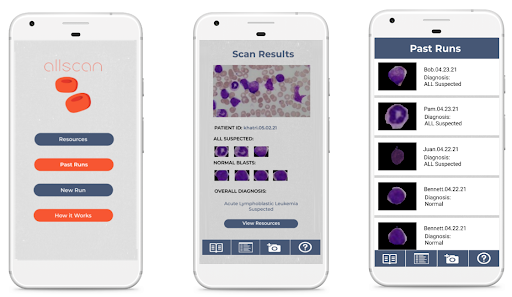
Using the hardware microscope and mobile device, first a user-taken or selected image of a Giemsa-stained thin blood smear is uploaded to the mobile app. Next, the model isolates the lymphocytes in the image based on differences in staining using a masking method in which all parts of the image but the cell in consideration are blacked out. Following initial masking, each lymphocyte is classified as exhibiting characteristics of ALL or as healthy using the binary classification model. This process is then automatically repeated for all lymphocytes within the cell. Following the image processing, the number of uninfected and infected lymphocytes is displayed as shown in the figure below. This data is stored directly on the phone in a format lower than 200 MB file restriction to allow the user to view past results at any time. In addition to the actual classification, the phone suggests if the individual may have ALL and shows relevant resources and health organizations to contact in order to ensure that they know the next steps required to receive treatment. The app also includes instructions for obtaining and staining a blood smear, instructions on how to use the microscope, and options to order replacement parts. Several screens from the mobile app are shown below.

Future Improvements
In order to improve, our leukemia detection model, we need to look into newer neural network architectures to see if the accuracy improves. One drawaback of neural networks is the inability to measure uncertainty. If we were able to generate a quantitative measure of uncertainity (i.e. Gaussian processes), this would help our users determine how much to trust our model’s decision. Finding ways to improve the resolution of our microscope will also help improve our accuracy.